loki tuning
Overview
Tuning and best practices for Loki 3.0.0+.
Environment
- Cluster: EKS 1.30
- Loki: 3.3.1 (helm chart)
Notes
loki-distributed is Deprecated
The loki-distributed chart is no longer updated beyond 2.9.x. Use the official loki chart maintained by Grafana Labs instead. Chart recommendations are available here. Distributed mode support release notes are available here.
From the Loki 3.0.0 release notes:
Helm charts: A major upgrade to the Loki helm chart introduces support for Distributed mode (microservices), includes memcached by default, and includes several updates to configurations to improve Loki operations.
For distributed mode in Loki 3.0.0+, set deploymentMode to Distributed (default is SimpleScalable):
# charts/loki/values.yaml (loki +3.0.0)
deploymentMode: Distributed
See #3086 issue for details on the loki-distributed deprecation.
Configuration Guide
Distributed Mode (loki)
Before Loki 3.0.0, the loki-distributed chart was required for distributed deployment. Since 3.0.0, the loki chart natively supports distributed mode. See grafana/helm-charts #3086.
Set deploymentMode to Distributed for microservice mode. Distributed mode is recommended for stable, scalable operations.
# charts/loki/values.yaml (loki v3.3.1)
deploymentMode: Distributed
For higher query performance, run Loki in Simple Scalable or Distributed (microservices) mode.
Distributed mode enables flexible scaling — e.g., scaling only ingester pods when write load is high.
Object Storage Configuration (loki)
Reference: Configure storage
Available storage types depend on the deployment mode:
| Deployment Mode | Storage Type |
|---|---|
| SingleBinary | Filesystem |
| SimpleScalable | Object storage (AWS S3, GCS, etc.) |
| Distributed | Object storage (AWS S3, GCS, etc.) |
Create an IAM Policy granting Loki access to the S3 bucket per the Storage docs:
{
    "Version": "2012-10-17",
    "Statement": [
        {
            "Sid": "LokiStorage",
            "Effect": "Allow",
            "Principal": {
                "AWS": [
                    "arn:aws:iam::<ACCOUNT_ID>"
                ]
            },
            "Action": [
                "s3:ListBucket",
                "s3:PutObject",
                "s3:GetObject",
                "s3:DeleteObject"
            ],
            "Resource": [
                "arn:aws:s3:::<BUCKET_NAME>",
                "arn:aws:s3:::<BUCKET_NAME>/*"
            ]
        }
    ]
}
Grant the Loki service account S3 bucket access via IRSA:
# charts/loki/values.yaml (loki v3.3.1)
serviceAccount:
  create: true
  name: null
  imagePullSecrets: []
  annotations:
    eks.amazonaws.com/role-arn: arn:aws:iam::<ACCOUNT_ID>:role/<ROLE_NAME>
  labels: {}
  automountServiceAccountToken: true
When serviceAccount.name is null, the chart creates a service account named after the chart:
$ kubectl get serviceaccount -n loki
NAME   SECRETS   AGE
loki   0         2d19h
Configure the S3 bucket and region:
# charts/loki/values.yaml (loki v3.3.1)
loki:
  storage:
    bucketNames:
      chunks: <BUCKET_NAME>
      ruler: <BUCKET_NAME>
      admin: <BUCKET_NAME>
    type: s3
    s3:
      s3: null
      endpoint: null
      region: ap-northeast-2
      secretAccessKey: null
      accessKeyId: null
      signatureVersion: null
      s3ForcePathStyle: false
      insecure: false
      http_config: {}
      backoff_config: {}
      disable_dualstack: false
Log Retention (compactor)
Reference: Log retention
Log retention in Loki is handled by the compactor or table-manager component.
table-manager (deprecated)
table-manager is deprecated and will be removed from Loki. Use compactor unless forced to use legacy index types.
Legacy index types (Loki v3.3.x):
- Cassandra (Deprecated)
- BigTable (Deprecated)
- DynamoDB (Deprecated)
- BoltDB (Deprecated)
Only use table-manager if your Loki instance uses one of these legacy index types.
compactor
By default, the compactor is disabled in Loki 3.3.1 chart, meaning logs are retained forever:
# charts/loki/values.yaml (loki v3.3.1)
compactor:
  replicas: 0
Enable the compactor (must be a singleton — exactly 1 replica):
# charts/loki/values.yaml (loki v3.3.1)
compactor:
  replicas: 1
Add compactor configuration with retention settings:
# charts/loki/values.yaml (loki v3.3.1)
loki:
  limits_config:
    retention_period: 7d

  compactor:
    working_directory: /var/loki/compactor
    compaction_interval: 10m
    retention_enabled: true
    retention_delete_delay: 2h
    retention_delete_worker_count: 150
    delete_request_store: s3
Set retention_enabled to true. Without it, the compactor only performs table compaction at compaction_interval.
Retention requires index.period of 24 hours. Both single-store TSDB and single-store BoltDB require 24h index periods.
# charts/loki/values.yaml (loki v3.3.1)
loki:
  schemaConfig:
    configs:
    - from: "2024-08-01"
      store: tsdb
      object_store: s3
      schema: v13
      index:
        prefix: loki_index_
        period: 24h
Important: Log retention only works when
index.periodis24h.
Verify the compactor config after upgrade:
kubectl exec -it loki-compactor-0 -n loki \
  -- cat /etc/loki/config/config.yaml
compactor:
compaction_interval: 10m
delete_request_store: s3
retention_delete_delay: 2h
retention_delete_worker_count: 150
retention_enabled: true
working_directory: /var/loki/compactor
limits_config:
# ... omitted for brevity ...
retention_period: 7dChunk Encoding (ingester)
chunk_encoding determines the compression algorithm for stored chunks. Loki 3.3.x supports:
- none
- gzip (default)
- lz4-64k
- snappy (recommended)
- lz4-256k
- lz4-1M
- lz4
- flate
- zstd
Default is gzip:
# The algorithm to use for compressing chunk. (none, gzip, lz4-64k, snappy,
# lz4-256k, lz4-1M, lz4, flate, zstd)
# CLI flag: -ingester.chunk-encoding
[chunk_encoding: <string> | default = "gzip"]
While gzip has better compression ratio, snappy offers faster decompression and thus faster queries. snappy is recommended.
Set chunk_encoding to snappy:
# charts/loki/values.yaml (loki v3.3.1)
loki:
  ingester:
    chunk_encoding: snappy
Verify after deployment:
kubectl exec -it loki-ingester-0 -n loki \
  -- cat /etc/loki/config/config.yaml
ingester:
autoforget_unhealthy: true
chunk_encoding: snappyzstd Compression (ingester)
Prometheus and Loki use Google's Snappy compression by default. Loki's zstd support was added via PR #3064.
zstd is a compression algorithm by Facebook (Meta) offering excellent compression ratio with fast compress/decompress speed. Compared to snappy, zstd achieves 30-40% additional storage savings.
Production test results on Loki 3.3.1:
---
title: Loki 3.3.1 zstd compression test results
---
%%{init: {"theme": "dark"}}%%
graph TB
    subgraph case1["Case 1"]
        direction LR
        subgraph bucket1["S3 Bucket"]
            A1["snappy<br/>14.4 GB"] -.-> B1["zstd<br/>9.5 GB"]
        end
        B1 ~~~ C1["34.4% saved"]
    end

    subgraph case2["Case 2"]
        direction LR
        subgraph bucket2["S3 Bucket"]
            A2["snappy<br/>57.2 GB"] -.-> B2["zstd<br/>35.2 GB"]
        end
        B2 ~~~ C2["38.4% saved"]
    end

    case1 ~~~ case2

    style A1 fill:#6c757d,stroke:#fff,color:#fff
    style A2 fill:#6c757d,stroke:#fff,color:#fff
    style B1 fill:#ff8c00,stroke:#fff,color:#fff
    style B2 fill:#ff8c00,stroke:#fff,color:#fff
    style C1 fill:#28a745,stroke:#fff,color:#fff
style C2 fill:#28a745,stroke:#fff,color:#fff- Case 1: 14.4GB → 9.5GB (34.4% saved)
- Case 2: 57.2GB → 35.2GB (38.4% saved)
Larger datasets show more pronounced zstd savings.
Set chunk_encoding to zstd to significantly reduce storage costs:
# charts/loki/values.yaml (loki v3.3.1)
loki:
  ingester:
    chunk_encoding: zstd
Combining zstd compression with an appropriate retention policy maximizes cost savings.
Prometheus Remote Write 2.0 and zstd
Prometheus Remote Write 2.0 currently only supports Snappy compression. However, zstd support is actively discussed in the community.
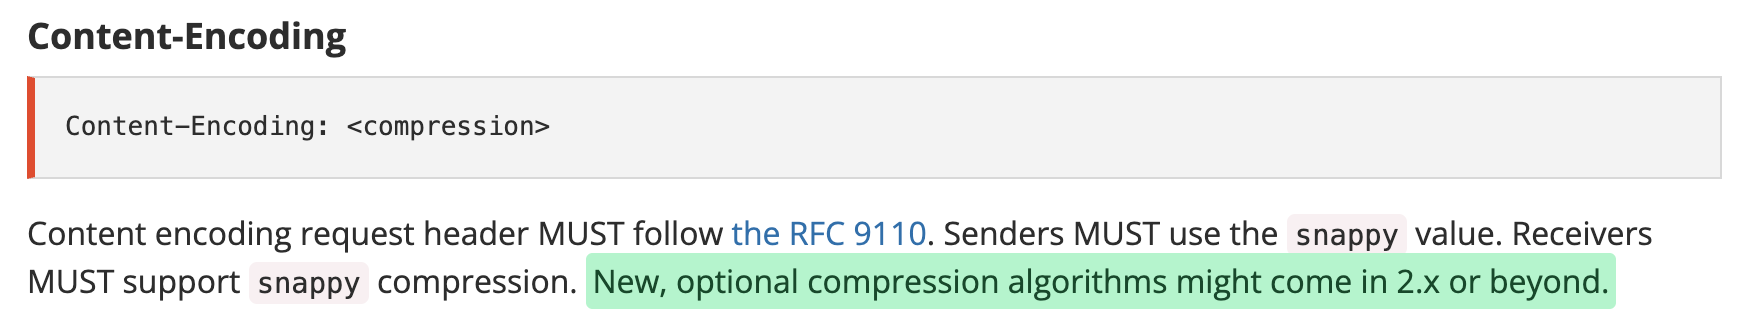
See GitHub issue #13866 for the discussion on zstd support in Prometheus.
Ring Issues (ingester)
When ingester pods fail to reach Ready state with the error found an existing instance(s) with a problem in the ring, check the ingester logs:
kubectl logs -f -l app.kubernetes.io/component=ingester -n lokiingester level=warn ts=2024-12-11T04:40:53.584292755Z caller=lifecycler.go:295 component=ingester msg="found an existing instance(s) with a problem in the ring, this instance cannot become ready until this problem is resolved. The /ring http endpoint on the distributor (or single binary) provides visibility into the ring." ring=ingester err="instance 10.xxx.xx.xx:9095 past heartbeat timeout"Enable autoforget_unhealthy to automatically remove unhealthy ingesters from the ring:
# Forget about ingesters having heartbeat timestamps older than
# `ring.kvstore.heartbeat_timeout`. This is equivalent to clicking on the
# `/ring` `forget` button in the UI: the ingester is removed from the ring.
# CLI flag: -ingester.autoforget-unhealthy
[autoforget_unhealthy: <boolean> | default = false]
# charts/loki/values.yaml (loki v3.3.1)
loki:
ingester:
autoforget_unhealthy: trueAfter applying, verify the ingester auto-forgets unhealthy instances:
ingester level=info ts=2024-12-11T04:53:52.685367155Z caller=ingester.go:454 component=ingester msg="autoforget is enabled and will remove unhealthy instances from the ring after 1m0s with no heartbeat"
ingester level=info ts=2024-12-11T04:53:52.685380651Z caller=loki.go:542 msg="Loki started" startup_time=85.227413ms
Essential Settings (ingester)
Reference: The essential config settings you should use so you won't drop logs in Loki
Critical ingester settings for uptime and high availability:
heartbeat_timeout (ingester)
heartbeat_timeout determines how long before an unresponsive ingester is skipped for reads/writes. If set too short, brief network delays can cause log collection to stop. If too long, a faulty ingester keeps receiving traffic.
Recommended: 10m — provides enough recovery time for ring abnormalities (e.g., Consul restart).
# charts/loki/values.yaml (loki v3.3.1)
loki:
  ingester:
    lifecycler:
      ring:
        heartbeat_timeout: 10m
Default is 1m:
# The heartbeat timeout after which ingesters are skipped for reads/writes.
# 0 = never (timeout disabled).
# CLI flag: -ring.heartbeat-timeout
[heartbeat_timeout: <duration> | default = 1m]
replication_factor (ingester)
Default replication_factor of 3 is recommended. Already the default, but can be explicitly declared:
# charts/loki/values.yaml (loki v3.3.1)
loki:
  ingester:
    lifecycler:
      ring:
        replication_factor: 3
Rate Limit (distributor)
Reference: Rate-Limit Errors
When a tenant exceeds the configured ingestion rate limit, Loki returns rate_limited errors. The distributor component enforces per-tenant ingestion rate limits.
Increase rate limits in limits_config globally or per-tenant via runtime overrides. Key settings: ingestion_rate_mb and ingestion_burst_size_mb.
Ensure the cluster has sufficient resources to handle higher limits.
Promtail error when rate-limited:
server returned HTTP status 429 Too Many Requests (429): Maximum active stream limit exceeded, reduce the number of active streams (reduce labels or reduce label values), or contact your Loki administrator to see if the limit can be increasedDefault rate limit settings:
# charts/loki/values.yaml
loki:
  limits_config:
    ingestion_rate_mb: 4
    ingestion_burst_size_mb: 6
Default values may cause intermittent 429 Too Many Requests errors. Recommended: increase to 20MB rate / 30MB burst:
# charts/loki/values.yaml
loki:
  limits_config:
    ingestion_rate_mb: 20
    ingestion_burst_size_mb: 30
After changes, monitor the gateway pod for healthy push requests:
kubectl logs -n loki -l app.kubernetes.io/component=gateway -f \
  | grep '/loki/api/v1/push'
10.xx.xxx.xxx - - [14/Dec/2024:03:35:13 +0000] 204 "POST /loki/api/v1/push HTTP/1.1" 0 "-" "promtail/2.9.8" "10.xx.xxx.xxx"
10.xx.xxx.xxx - - [14/Dec/2024:03:35:23 +0000] 204 "POST /loki/api/v1/push HTTP/1.1" 0 "-" "promtail/2.9.8" "10.xx.xxx.xxx"For more details on rate limiting:
References
Loki official best practices:
- Configuration best practices
- The essential config settings you should use so you won't drop logs in Loki
Loki: